The Zone System
Introduction
The famous American photographer, Ansel Adams, the first time developed a system called the Zone System. He tried for years to reach his proposed method to perfection. Ansel Adams was the first American photographer, completed the landscape photography in terms of technique.
"The Zone System is a framework for understanding exposure and development and visualizing their effect in advance. Areas of different luminance in the subject are related to exposure zones, and these in turn to appropriate values of gray in the final print. Thus careful exposure and development procedures permit the photographer to control the negative densities and corresponding print values that will represent specific areas, in accordance with the visualized final image." Ansel Adams
Thus, the photographer would be able to control the quality of the gray tones of image, before exposure. In fact, any photographer which uses this technique could be by looking at any subject, embodied the values of the gray tones that can be printed on paper. And then guided the entire process of their work, to earn the required quality.
If you look at Figure 1, you will understand the exposure problems.
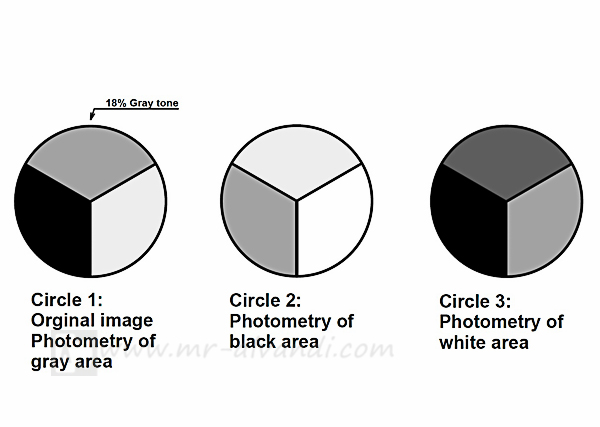
Circle 1, is includes the tones of white, black and gray 18%. Metering in the circle 1, been done from the top of the circle, which is 18% gray. Thus, in this circle, white tone is a very little gray, and black is yet black.
In circle 2, the metering is done from the black area. But, the black area is seen the 18% gray, and the white area have not a little gray tone. And the top of circle, which was already 18% gray, now has a little gray tone.
In circle 3, the metering is done from the white area, therefore, the white area is seen the 18% gray. And the top of circle, composed of dark gray tone. But black area stays yet black.
According to figure 1 it turns out, all photometers, measuring the intensity of light according to 18% gray. They cannot think. They do not know that for example when the subject is completely white or completely black. As a result, does not work properly. This issue includes all hand-held photometers, as well as internal light meter of analog or digital cameras. This is the key to successful use of all of the reflected light meter.
The best way to determine the correct exposure in the above example, is the use of Zone System and intensity of tones in print.
The Zone System is useful for two reasons:
1– It will help you to find a program yourself, so you can get the best possible quality from the negative film, paper and developer under your working conditions.
2– You will be able to fine-tune the results of high or low exposure (Dynamic range), and according to the need of the subject, change it, wider or more compact. (change contrast)
This method has been developed for Large format black and white film, because the photographer is able to separate the developing and printing. However, this method will be used for 35 mm or 120 roll film or digital capture.
It is recommended to use of the sheet film and a separate light meter initially, and after learning, apply this method to roll film.
Principles
In this system, you're looking at the subject in a series of brightness. From the darkest shadows to the brightest intense light, creates a series of gray scale. This system including the 8 gray tone as well as completely black, Zone 0 and completely white, Zone IX.
When you expose and develop film, you will be faced with a negative image of the subject, that is, an image in which the light dark values are reverse of those in the scene that you photographed. Then, when you're printing the negative, re-reversed image and values of the gray tone is printed in accordance with the values of the landscape. The ratio between print tone and brightness in different parts of the main stage, depends on the following:
1– The characteristics of the printing paper you use
2– How the negatives is printed
3– How the film has been exposed and developed
If we remove the first two, the quality of negatives in terms of exposure and develop will be very important.
How to use the Zone System?
There are three important part in Zone system:
1– Measuring the brightness of the subject
2– Determination of exposure
3– Developing the film for the appropriate duration
To understand the principles of Zone System, you should pay special attention to the ratio between the brightness of the object, the exposure of the film, developing time, density of negative and intensity of tones printing.
Equipment required:
– Camera and tripod
– If possible, a handheld light meter
– A writing pad and pencil
– Matt white cardboard with dimensions 70x70 cm
Instructions:
1– Install on a wall, matt white cardboard on the outside of the house. So that the midday sun shine directly.
2– Transfer the sensitivity of the film to light meter.
3– Check the amount of light in different areas of the white board to be uniform. Then measure the amount of light in the central region.
4– Focus your lens at infinity.
5– Transfer light meter readings to the camera and take a picture.
6– In Notepad, draw a table as shown in Table 1, and the shutter speed and aperture used, write front Zone V.
7– Then, change the frames, and you decrease the exposure one stop and then take a picture, then respectively record the front Zones 0, I, II, III, IV.
8– Change the frame again like the previous step, but at this point every time you increase the exposure one stop and then take a picture. And respectively record the front Zones VI, VII, VIII. In table 1, have been recorded a series of similar exposures. But your values may be different with this table. Your values, depends on the film speed and the brightness of cardboard.
9– Developed Films in accordance with the method and time recommended by the manufacturer, or by method and time you've got before.
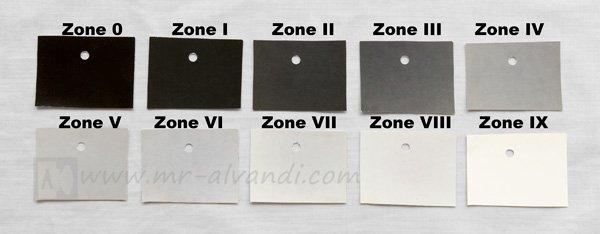
10– Print developed negatives, in accordance with the conditions of negative Zone V and or 18% gray. The results respectively will be similar to Figure 2
| Zone | Sutter speed | Aperture |
| 0 | 1/1000 | f/8 |
| I | 1/500 | f/8 |
| II | 1/250 | f/8 |
| III | 1/125 | f/8 |
| IV | 1/60 | f/8 |
| V | 1/30 | f/8 |
| VI | 1/15 | f/8 |
| VII | 1/8 | f/8 |
| VIII | 1/4 | f/8 |
| IX | 1/2 | f/8 |
| X | 1 | f/8 |
Conclusion
All light meters, measured everything based on the 18% gray. In the above instruction, the light meter values was according to Zone V, and then you changed the exposure and recorded on film and printed on paper. Thus, by measuring the brightness of a subject on the basis of Zone V, and depending on the gray tones, which is achieved after printing, you did corrected tonality properly.
Assessment according to the Zone System
Gray printing shown in Figure 2 gives us good information. According to the prints, it is clear that reducing the exposure of the film, creating a darker print (Zone IV). And the increase in exposure will create a brighter print (Zone VI). When we set the exposure based on Zone V, and change the exposure one stop, in fact, we've changed the exposure value as much as one Zone. And in the printing of a gray tone would be more or less as much as one scale.

Each Zone is equal to one-stop exposure difference with the adjacent Zone. Zone V is equivalent to 18% gray, and Zone I is the minimum density on the film, or the maximum recognizable black on paper. Zone VIII is also the maximum darkness on the negative, or minimum textured white, on paper. In fact, the spectrum of gray created in each image is placed in the 8 area.
So measuring the light of the subject, and then reduce the exposure as much as one stop, creating Zone IV value on the film and thus the gray tone IV in print. Also, increasing exposure as much as one stop, creating Zone VI on the film, and will create gray tone VI in the print.
Dynamic range and Textural range
In Figure 3, the basis print located in the center of the Zone V, which is consistent with reflectance 18% gray card. If you look carefully at the areas of Zone III and Zone IV, details and textures can be seen clearly. In Zone II only visible trace of an object in the scene, but the details of its construction is not seen. Zone I area is almost completely black with no trace of the subject texture. Zone 0 area of greatest blackness without texture and detail that can be created in printing paper.
A similar action occurs in brighter areas. Areas of Zone VI, Zone VII demonstrates good detail and texture. The Zone VIII is quite clear, but still can be seen texture. Zone IX, is close to pure white. But the Zone X, showing complete white paper.
Ansel Adams divided the total range of exposure that can be print, into three categories.
1– Full range: Including gray tones values of Zone 0 to Zone X.
2– Dynamic range: Including gray tones values of Zone I to Zone IX.
3– Textural range: Which including gray tones values of Zone II and Zone VIII, and demonstrates the quality and texture of the object.
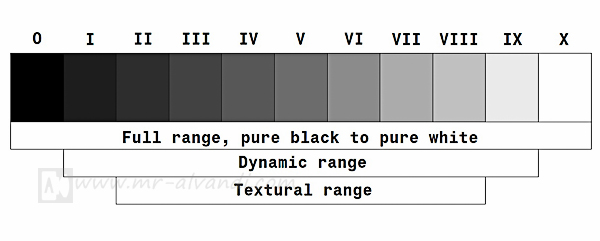
Ansel Adams determined Zone I for minimum density required for printing. This very low density, is created only on film. But it is insignificant, that cannot be identified in print. Higher density of Zone X (Zone XI, XII, XIII and XIV) can be recorded on film, but these amounts are unusual and may not be recognizable in print.
How to be seen various objects with gray tones
If you analyze black and white prints, usually you will find the most common objects that have a specified tones, and reduced their values, to relative. For example, most photographers will print average sunlit Caucasian skin as a Zone VI tonal value, average dark foliage as a Zone IV tonal value, textured snow in sunlight as a Zone VIII tonal value, dark but textured surface as Zone III values, and so forth.
The following table indicates relative brightness compared to, Zone and tones printed.
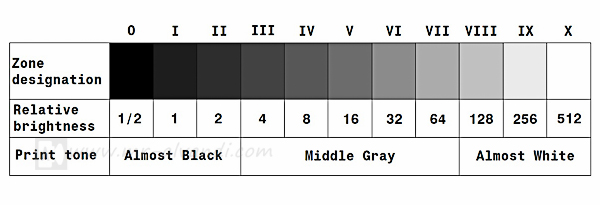
The following table shows the characteristics of the gray tones various objects in the print, based on the Zone system.
| Zone 0 | Pure black.Total black in the print. | |
| Zone I | Near black with slight tonality. no texture. | |
| Zone II | Textured black. The darkest part of the image in which slight detail is recorded. | |
| Zone III | Average dark materials and low values showing adequate texture. | |
| Zone IV | Average dark foliage. Dark stone. Landscape shadow. Recommended shadow value for portraits in sunlight. | |
| Zone V | Clear north sky (panchromatic rendering). Dark skin. Gray stone. Average weathered wood. Middle gray (18% reflectance). | |
| Zone VI | Average Caucasian skin. light stone. shadows on snow in sunlit landscapes. | |
| Zone VII | Very light skin. Light gray objects. Average snow with acute side lighting. | |
| Zone VIII | Whites with textures and delicate values (not blank whites). Snow in full shade. Highlights on Caucasian skin. | |
| Zone IX | Slight tone without texture. Glaring snow. Snow in flat sunlight. | |
| Zone X | Pure white. light sources and specular reflections. |
The use of other tones when the Zone V is based
Because the density of negatives and printed tones in an image is equal to relative reflection the object in, the shooting scene, and also because, at the time of shooting, you did photometry based on the Zone V middle Grey, therefore all other tones of the landscape, based on the their relative brightness, placed in one of the areas of Zone I up to Zone VIII.
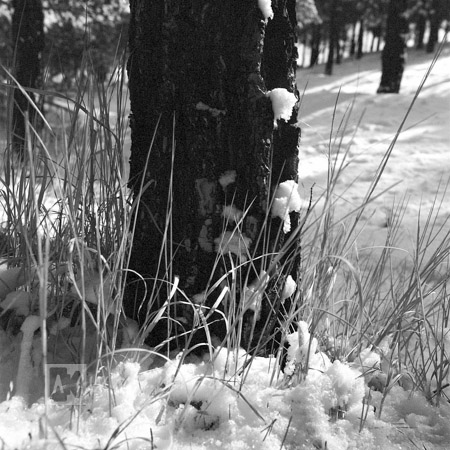
Suppose you plan to take a picture of a tree trunk, and texture gray tones is equivalent to Zone III. You can measure the amount of light the trunk of a tree, and keep it in your mind. This amount is equivalent to Zone V, or 18% middle gray. Because the Zone III tone, is 2 stops darker than the Zone V tone, you should reduce the exposure, 2 stops less than the meter indicates. So you'll have less density in the negative, and thus, and 2 stops more tonality value in print.
Another example:
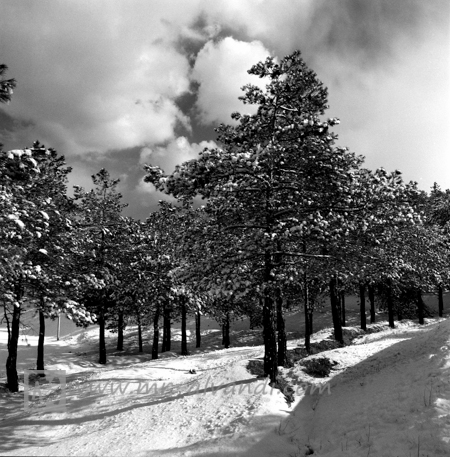
If you take a picture of a snowy scene, you will imagine clearly, snow, a white texture. The amount of white tune, is comparable to the Zone VIII Print tone. If you measure the landscape light, the light meter numbers will show, 18% middle gray tone of snow (which is the Zone V). So you need to increase your exposure as much as 3 stops, to make sure the Zone VIII tone, in print for snow. Because of snow, according light meter numbers, can be seen 18% middle gray, and photographer underexposed the film.
When you keep in mind the measured values of sunlight or shadows in scene, and used to determine exposure, all other tone values, according to their reflections is decreased or increased, and will be placed in one of the areas of Zone I and Zone VIII.
Print tones and the use of the spot meter
In the image below, the values printed tone, measured by a spot meter in the landscape. If you put aside your camera, and work with a manual spot meter, you can easily measure the components of a scene selectively.
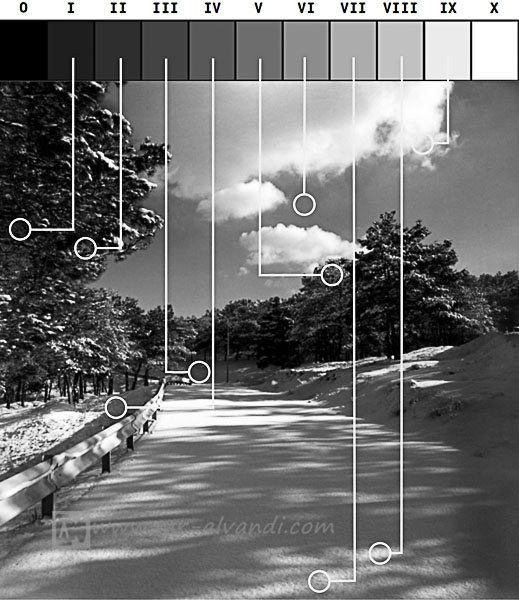
For example, if you measure the light forest from the distant, and put the light reflections on Zone V, and then measure the light snow, the light meter will show three different stops. Similarly, if you measure the average brightness of shadows under the trees in the forest, it is 2 stops darker. So you can measure the brightness of all levels of scene.
If you put the reflected light of a part of scene components, on each of the Zone, other components will be placed automatically on the appropriate Zone with their relative brightness.
If you use a wide-angle light meter to measure the amount of light, will be exposure value the same amount? Maybe yes and maybe no. The sky is too bright. If the light meter measure the more light from the sky, you will have certainly 1 or 2 stop underexposure.
The use of printed cards to predict the future
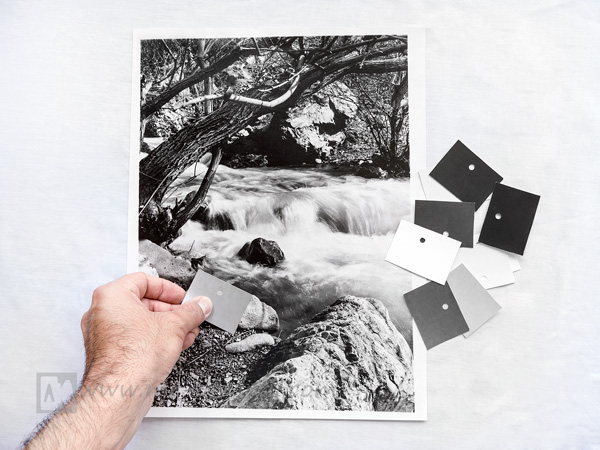
Printed cards from the Zone I - VIII tones, are very useful to check the printed photos. These cards are printed by using Zone I to Zone VIII negatives, on paper with normal contrast (No. 2). You can make a hole on top of them, and put on other photos, you measure the gray values of other images. This is one of the best exercises to get to know gray values on the subject various.
Some needed advice:
1– Try to use a standard procedure to your work.
2– Try to use a kind of film and a kind of developer.
3– Already you measure the sensitivity of the film. You can use my technique for measuring the film speed.
4– Use of an developing method for your films. You can use my technique for developing black and white films.
5– You print Zone I - VIII gray tone cards, on paper with normal contrast (No. 2).
6– Zone I - VIII gray tone cards help a lot to learn and use the Zone system.
7– You can do exercises to evaluate the different landscapes gray tones. By light meter, you can measure the light from different areas, then calculate the difference in tone them without your take a picture.
8– This method is best suited for large format photography by sheet film, but you can use this method to roll film and digital photography, after learning.

